

RS Rating and RS Line: Reading Relative Strength on CSE Stocks
What the RS Rating and RS Line measure, how to read the RS Line against its 21-day EMA, and how to use both in your decisions, with real CSE examples.
Between 1 July and 9 October 2026 the All Share Price Index (ASI) fell 8.7%. Over the same period Haycarb rose 24.6%, Chevron Lubricants edged up 1.7%, and John Keells fell 9.4%.
Looking only at each stock’s own chart, you’d see one strong stock, one flat one and one falling one. Relative strength asks a more useful question: how is each stock doing compared with the market? By that measure, Chevron Lubricants’ flat 1.7% was a strong performance in a falling market, and John Keells did slightly worse than the market.
CeylonCharts measures relative strength in two ways: the RS Rating and the RS Line. This article explains both, how to read the RS Line against its 21-day EMA, and how investors use these signals when deciding what to do.
All figures are closing prices up to Friday, 9 October 2026, from CeylonCharts’ daily CSE data.
The RS Rating: a 1–99 league table
The RS Rating ranks every rated CSE stock by its price performance over the past year, on a scale of 1 to 99.
How it’s calculated:
- For each stock, take the percentage price change over the last 3, 6, 9 and 12 months. The latest 3 months count double (40%), and the other three periods count 20% each. This gives the stock an “RS score.”
- Sort every stock’s score from weakest to strongest and turn its position into a rating from 1 to 99.
So a rating of 90 means the stock has outperformed roughly 90% of rated CSE stocks over the past year, and 99 is the strongest. A stock needs about a year (253 trading sessions) of history to get a rating. The Methodology page has the exact formula.
How to read it:
| RS Rating | What it tells you |
|---|---|
| 90–99 | Among the market’s strongest performers over the past year |
| 80–89 | Clearly outperforming most of the market |
| 50–79 | Middle of the pack |
| Below 50 | Underperforming most stocks |
Two things to keep in mind:
- It’s a ranking, not a return. In a falling market a stock can have a high rating while its price is down; it just fell less than almost everything else.
- It’s slow. Because it looks back a whole year, the rating can stay high for weeks after a stock has started to weaken. That is where the RS Line comes in.
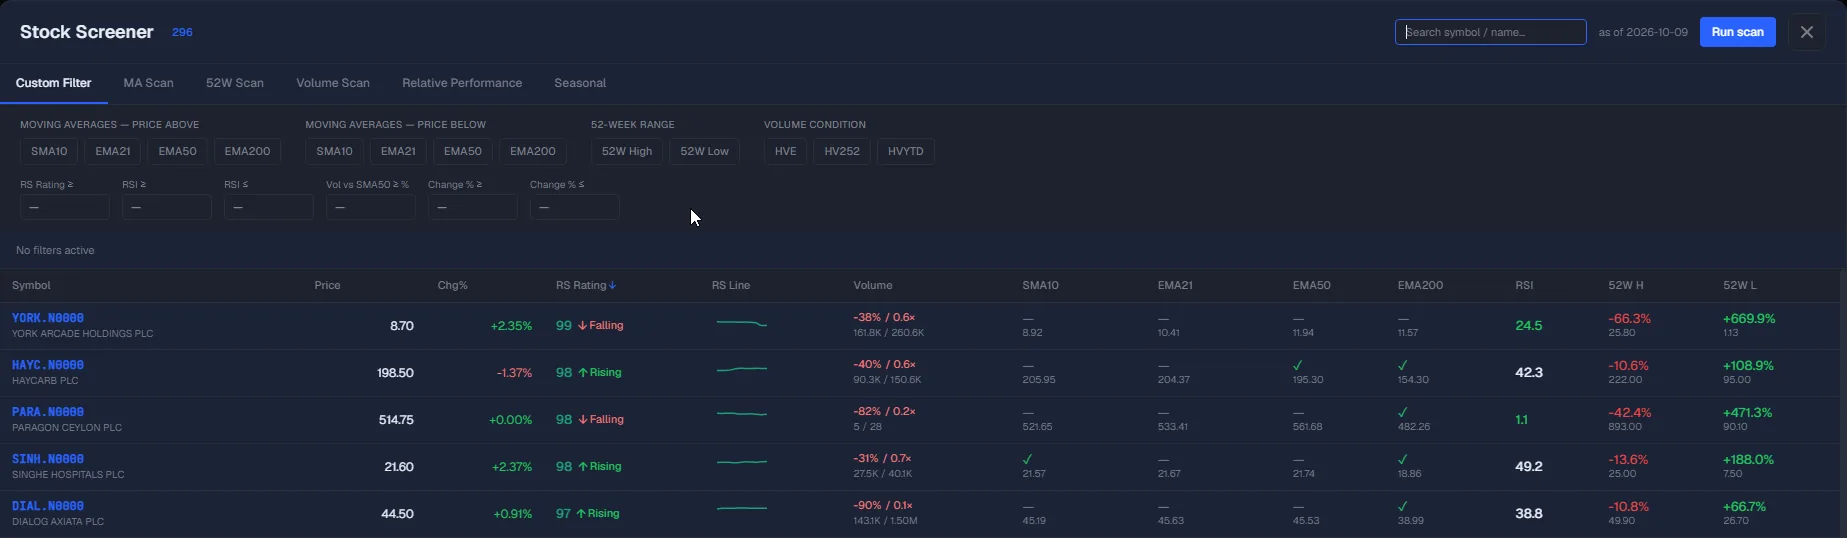
You’ll find the rating in the screener, where every stock can be sorted by it. Next to each rating is a Rising, Falling or Flat label and a small RS Line chart. Note that these describe the RS Line, not the rating: the mini chart is the stock’s RS Line at the close of each of the last 10 weeks, and the label says whether it has risen or fallen by more than 1% over that time. A high rating with a Falling label is a stock that was strong over the year but has started to lag recently.
The RS Line: relative strength, day by day
The RS Line is a stock’s closing price divided by the ASI’s closing price on the same day:
RS Line = stock’s close ÷ ASI close
You don’t need to read the number itself; what matters is its direction:
- RS Line rising: the stock is beating the market, whether its price is rising faster or falling more slowly than the ASI.
- RS Line falling: the stock is lagging the market.
- RS Line flat: the stock is moving in step with the market.
On CeylonCharts the RS Line is drawn on the price chart, just below the candles, and its height is scaled to sit there neatly. Its level on the chart has no meaning of its own; only its slope does. The stock’s current RS Rating is shown in a label at its right-hand end (e.g. “RS 89”).
New-high dots
A small dot appears above the RS Line when it makes a new 52-bar high, meaning its highest point in 52 bars: about 2½ months on a daily chart, or a year on a weekly chart. RS Line new highs are one of the classic traits of market leaders. They often appear before the price itself breaks out, because a stock that’s holding up while the market dips is showing that buyers are supporting it.
Example: Chevron Lubricants. Between July and October its price barely moved, but the ASI fell 8.7%. Apart from a brief dip in early September, its RS Line climbed and made a new high on 8 October 2026, while its RS Rating stood at 89. On the price chart alone, LLUB looked dull; the RS Line showed it was one of the market’s strongest stocks over that period.
Adding the 21-day EMA to the RS Line
An RS Line moves every day, and day-to-day wiggles are mostly noise. To see its trend, CeylonCharts can draw an exponential moving average (EMA) of the RS Line, set by default to 21 bars, roughly one month of trading on a daily chart.
On the chart:
- The EMA is the dashed line next to the RS Line.
- The space between them is shaded green when the RS Line is above its EMA and red when it’s below.
- Hover over a bar and the tooltip says EMA21: above or EMA21: below.
What the RS Line’s position against its 21 EMA tells you
| What you see | What it means |
|---|---|
| RS Line above a rising EMA (green, widening) | Relative strength is improving: the stock has been beating the market for the past month or so |
| RS Line above a flat EMA | Still outperforming, but momentum is slowing |
| RS Line crosses below the EMA | Recent relative performance has turned weaker than its one-month trend. This is an early warning, not a verdict |
| RS Line below a falling EMA (red, widening) | The stock is persistently lagging the market |
| RS Line crossing back and forth across a flat EMA | No real relative trend. Treat individual crosses as noise |
The EMA is useful because it changes faster than the RS Rating. A stock can still be rated 95 while its RS Line has already been below its EMA for two weeks.
Four real examples (as of 9 October 2026)
| Stock | RS Rating | RS Line vs its 21 EMA | Price, 1 Jul → 9 Oct | ASI, same period |
|---|---|---|---|---|
| Haycarb | 98 | Just slipped below (−0.4%) | +24.6% | −8.7% |
| Chevron Lubricants | 89 | Above, by 2.3%; new RS high on 8 Oct | +1.7% | −8.7% |
| Dialog Axiata | 97 | On the EMA (+0.05%); crossed it 6 times since 15 Sep | −2.2% | −8.7% |
| John Keells | 53 | Just crossed above (+0.25%) after five weeks below | −9.4% | −8.7% |
Haycarb: a leader showing its first crack
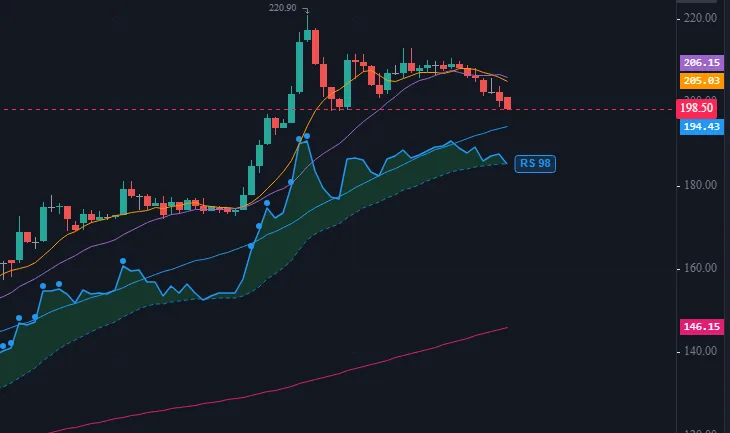
Haycarb is one of the market’s strongest stocks over the past year, with an RS Rating of 98. Its RS Line peaked on 4 September, the same day its price peaked at LKR 218.50. Since then the RS Line has flattened, and on 9 October it closed below its 21 EMA for the first time since mid-August. The price, at LKR 198.50, is 9% below its high and below its own 21-day moving average.
But look at the date. Haycarb went ex-dividend on 9 October. When a stock goes XD, its price drops by roughly the dividend amount, about half a percent here, and that alone is bigger than the 0.4% gap below the EMA. This is exactly why a single day’s cross needs confirmation: wait to see whether the RS Line stays below the EMA over several sessions and whether the EMA itself starts to turn down.
Chevron Lubricants: strength in a falling market
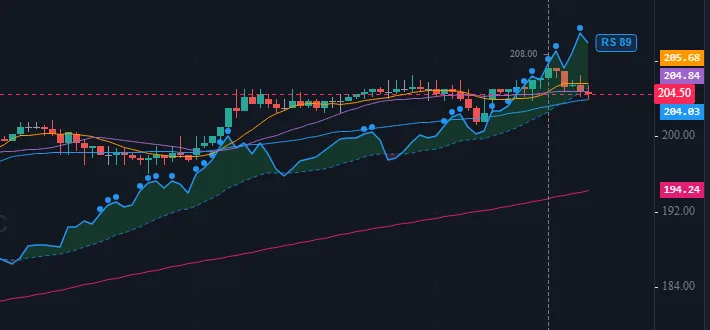
LLUB’s RS Line is 2.3% above its EMA, the EMA is rising, and the line made a new high on 8 October. This is what improving relative strength looks like. The next question an investor would ask is whether the price follows: RS Line strength that comes before a price breakout is a classic pattern, but it isn’t guaranteed.
Dialog: a high rating, but no current signal
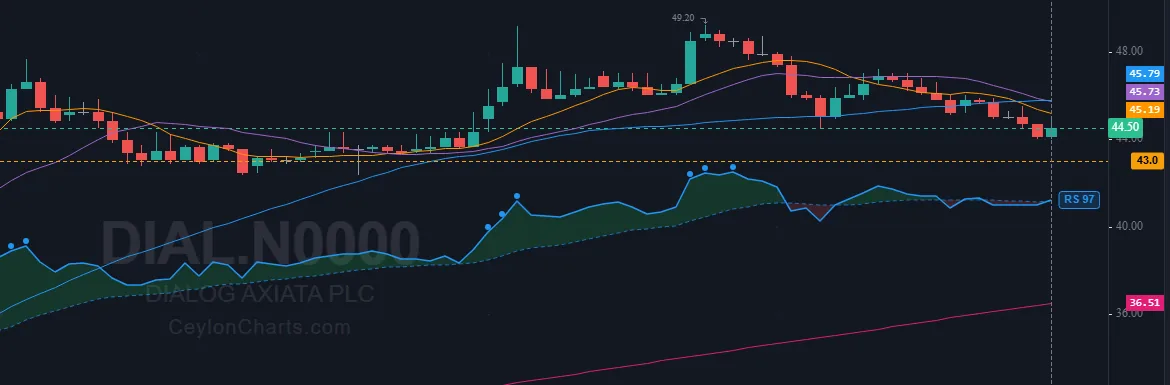
Dialog’s RS Rating of 97 reflects a strong year, but its RS Line has been moving sideways since mid-September. It crossed its 21 EMA six times between 15 September and 9 October, and is now just 0.05% above it. When the RS Line hugs a flat EMA like this, the crosses carry no information. Meanwhile the price has dropped below its own 21-day and 50-day moving averages. The high rating describes the past year; the RS Line says the stock is currently just keeping pace with the market.
John Keells: a cross isn’t a turnaround
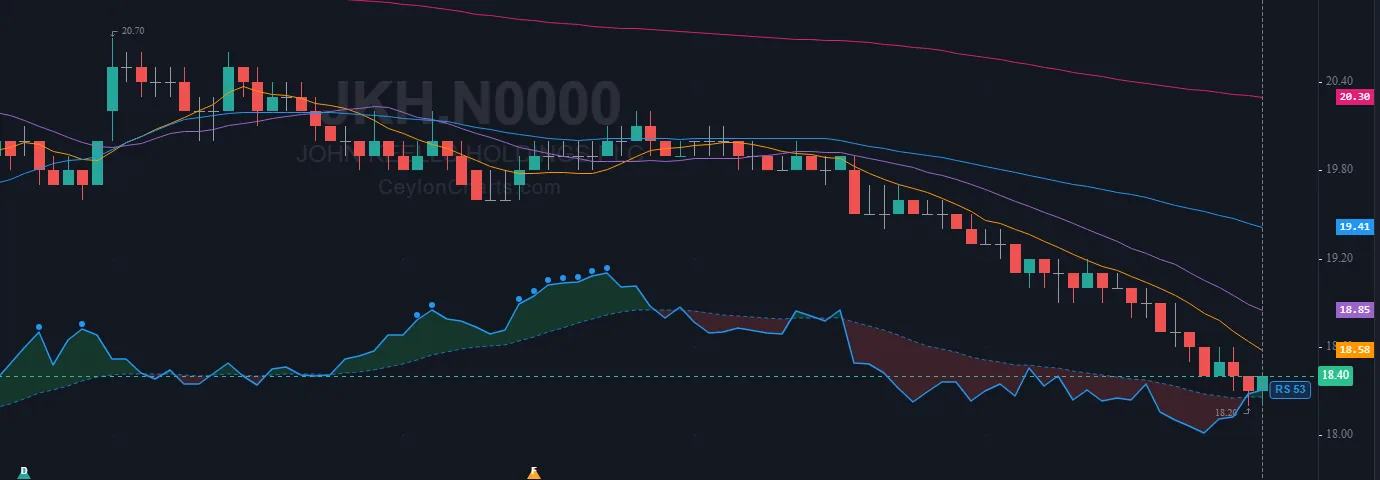
JKH’s RS Line crossed back above its EMA on 8 October after being below it since 1 September. That looks like good news, but its RS Rating is 53, its price is below its 21-, 50- and 200-day moving averages, and it is still near its 52-week low. Between 11 August and 1 September its RS Line also crossed the EMA seven times without starting a trend. One cross in a lagging stock is a reason to keep watching, not evidence that leadership has changed.
Using relative strength in your decisions
Relative strength doesn’t tell you what a stock will do. It tells you how the market has been treating it. Here’s how investors who follow this approach typically use it, step by step.
1. Shortlist with the RS Rating. Many relative-strength investors only look at stocks rated 80 or higher, on the idea that market leaders tend to come from stocks already outperforming. In CeylonCharts, set RS Rating ≥ 80 in the screener.
2. Check the RS Line’s current trend. From that shortlist, favour stocks whose RS Line is above a rising 21 EMA, ideally with recent new-high dots. That shows the strength is still active, not just left over from earlier in the year.
3. Confirm with the price chart. Relative strength works best alongside a healthy price trend: price above its own 50-day and 200-day moving averages, and ideally an RS Line making new highs as the price breaks out of a base.
4. Watch for the warning signs if you hold the stock. The first red flag is usually an RS Line that closes below its 21 EMA and stays there for several sessions while the EMA flattens or turns down, especially if the price also breaks its own 21- or 50-day average. Many investors treat that as a signal to review the position, for example by tightening a stop or checking the news and results. It is not an automatic sell.
5. Filter out the noise.
- Ignore crosses when the RS Line is hugging a flat EMA (as with Dialog). Wait for the gap to widen.
- Check for XD dates, rights issues and other corporate actions around a sudden move (as with Haycarb). They can push the RS Line across the EMA for reasons unrelated to demand.
- Be wary of thinly traded stocks: a single small trade can move the RS Line sharply.
- On weekly charts, crosses are fewer and more meaningful; use them to confirm what the daily chart suggests.
6. Never use it alone. Relative strength says nothing about whether a company is cheap, profitable or well run. Pair it with the fundamentals; our guide to P/E, P/BV and dividend yield is a good place to start. Then set alerts on the levels that matter so you don’t have to watch every day.
How to switch it on in CeylonCharts
- Open any stock’s chart and click Indicator at the top.
- Choose RS Line (listed as Relative Strength Line & Rating, in the advanced indicators available on the Pro plan).
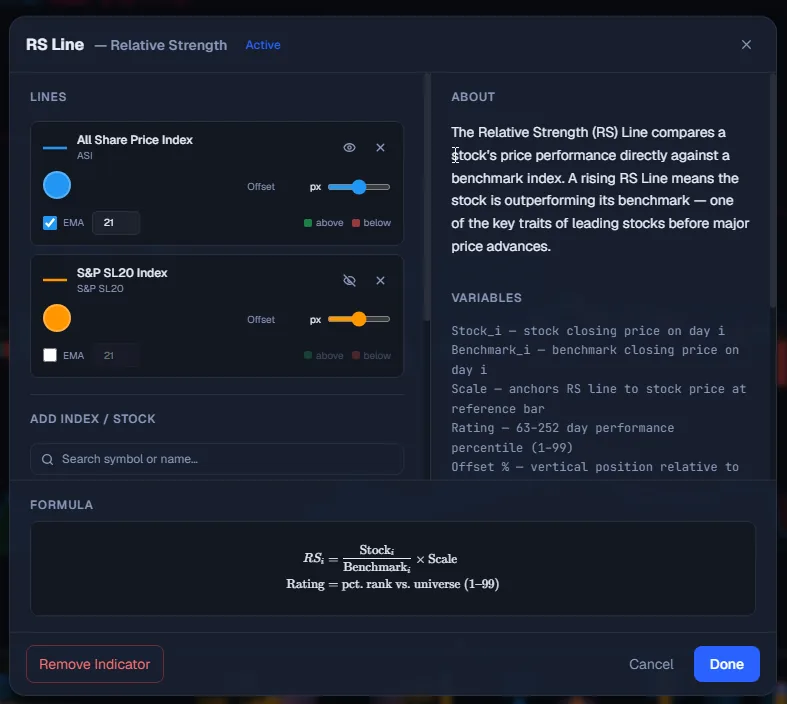
- Under Lines, the All Share Price Index and S&P SL20 are ready to use as benchmarks. You can add a sector index or another stock under Add Index / Stock, or compare two stocks directly under Stock vs Stock.
- Tick EMA next to a line to draw its moving average. The period defaults to 21.
- Use the Offset slider if the line overlaps the candles.
The RS Rating is also shown for every stock in the screener’s results, so you can rank by it without opening each chart.
Limitations
- The RS Line and RS Rating describe past price behaviour. They are not forecasts.
- Both depend on the benchmark. A stock can lead the ASI but lag its own sector; comparing against a sector index tells you which.
- Price data is adjusted for splits and bonus issues, but dividends and rights issues can still cause one-off jumps in the RS Line.
- The 21-period EMA is a convention, not a magic number. A shorter period reacts faster but crosses more often; a longer one is smoother but later.
This article is for education and information only. It is not investment advice or a recommendation to buy or sell any security. Figures come from public Colombo Stock Exchange filings and CeylonCharts data as of the date stated, and may contain errors. Do your own research or speak to a licensed adviser before investing.